

The COVID Crisis: Pandemic, Casedemic, or Gross Incompetence?

Introduction
This document is written to provide evidence in support of an open letter written to Members of Parliament in Malaysia as well as selected members of the Malaysian Government and Administrative Departments, in February 2022.
All information presented in this document comes from public and open-source data sets, which can be viewed by any reader unless those public data sets or related documents are removed.
In this report we first explore why COVID-19 measures need to be stopped in their entirety. We then go on to look at whether the COVID-19 measures should ever have been implemented in the first place, and if not why not. Finally we explore the elephant in the room, and address the possibility of whether or not the COVID-19 vaccines perhaps do more harm than good.
Part 1. Why COVID-19 Measures, Especially Vaccinations, Must Be Stopped.
1. There is no more crisis
From the public data that is available for everyone to analyze, it is clear that the public health crisis once perceived as threatening to the welfare of the country is subsiding. In Figure 1 you can see that, as of Feb 22, 2022 the number of deaths per day associated with COVID-19 are down more than 95% from the peak.

Figure 1. COVID-19 Death by Date Source: https://covidnow.moh.gov.my
You should also note that the peak happened in 2021, after a few months of vaccine roll out. No such peak occurred in 2020.
Over the last two years governments around the globe have mounted large, costly, aggressive pandemic responses to the COVID-19 outbreak. However, in the face of mounting evidence that the COVID-19 pandemic is now over, and that measures being used to stop the pandemic are creating unnecessary collateral damage, some countries including Sweden, Denmark, Iceland, the UK and Switzerland have now rolled back their pandemic response plan and lifted the requirement for vaccine passports.
Despite this, Malaysia is still currently implementing heavy restrictions on its citizens. While COVIDNOW is once again showing a rapid growth in COVID-19 cases, these cases to not appear to be creating further death. The death curve is now clearly tailing off. The most recent mortality data taken from COVIDNOW are shown below.
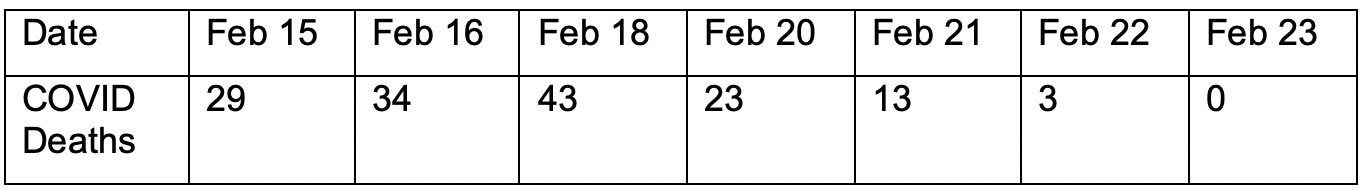
Table 1. COVID-19 Deaths by Date of Death. Source:
Source: https://covidnow.moh.gov.my
Whether or not cases, as measured by PCR or RTK tests alone, should ever be used to decide that a pandemic is raging is a matter of serious controversy. Positive test results do not necessarily reflect either the presence or seriousness of disease. This is discussed later in this document under the subheading: Panic Driven by a “Casedemic”.

Not only is there no more crisis, but everyone in Malaysia will remember being told by KKM (The Malaysian Ministry of Health) that when enough of the Malaysian population had been vaccinated the country would achieve herd immunity. The population was told that when this goal had been achieved the pandemic would be over.
KKM told Malaysians that according to the WHO an estimated 60 to 70% of the world's population needs to be resistant to #COVID19 in order for 'cluster immunity' to be achieved and the spread of #COVID19 to be controlled.

Given that Malaysia is now way past the peak in deaths that occurred in August 2021, and given that the threshold number of 60-70% of population being vaccinated to remove all restrictions has been achieved, all COVID-19 restrictions, especially the ongoing coercion for people to be vaccinated, should be ended immediately.
2. SOPs differentiating between vaccinated and unvaccinated are meaningless and fuel discrimination
A major thrust of the approach of KKM to stopping the COVID-19 pandemic has been to get a majority of people in Malaysia jabbed with the COVID-19 vaccines.
In order to “encourage” people in Malaysia to be vaccinated with COVID-19 vaccine(s) the government created SOPs that, in effect, deprive non-vaccinated people of the rights to freedom of movement, freedom of association, and freedom to work guaranteed under the Federal Constitution of Malaysia. That is to say, individuals who insist on their right to full informed consent before partaking of a medical intervention are, in effect, prevented from living their life. Whether or not such an outcome is ever justified is an open question.
For now, what really matters is this question: is a policy of limiting access to services for unvaccinated people fair? Does it even make any sense? To begin with, we need to understand infection rate data. Based on data from the KKM COVIDNOW GitHub repository, the percentage of non-vaccinated people having a COVID-19 positive test result is now lower than the percentage of the population who have not yet been vaccinated.
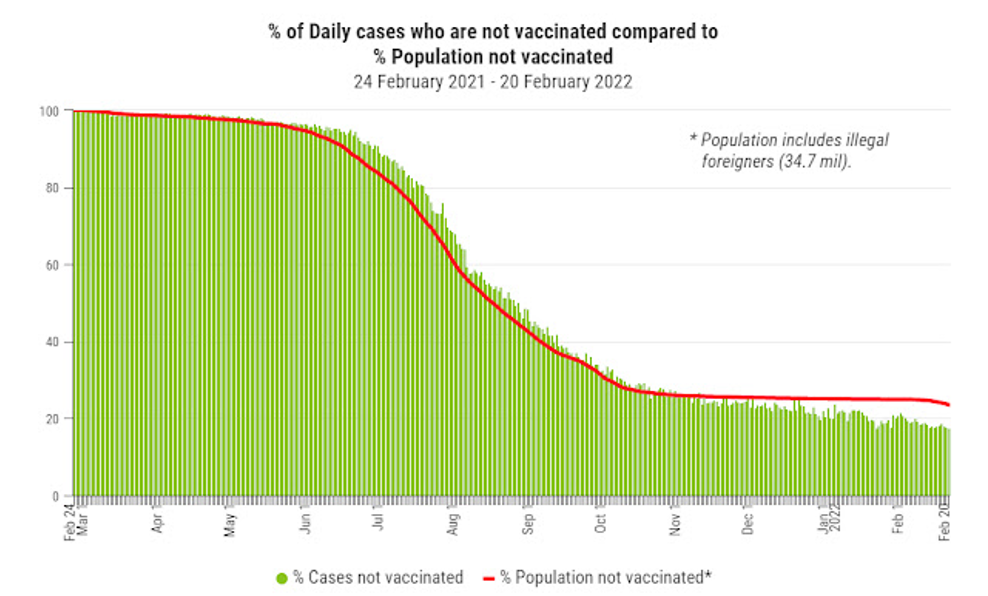
Figure 2. Cases in the Unvaccinated. Data source: KKM GitHub Repository
At the same time, the percentage of fully vaccinated people testing positive for COVID-19 is higher than the percentage of fully vaccinated people in the population, as we can see in the graph below. This basically means that vaccinated people have a higher probability of testing positive for COVID-19 than do unvaccinated people, and they will also be spreading more virus per capita infected than the unvaccinated.

Figure 3. Cases in the Fully Vaccinated. Data source: KKM GitHub Repository

Figure 4. Cases in the Boosted. Data source: KKM GitHub Repository
The percentage of COVID-19 cases in people who have had booster shots are increasing as well, as we can see in above graph.
It should be noted that since vaccines are given to illegal foreigners, the population used to calculate the percent of vaccine recipients should also include illegal foreigners, but the official population numbers given by the Ministry of Health only counts Malaysian citizens and legal foreign residents. The official population is 32.7 million, but the population including illegal foreigners is 34.7 million by our calculations. The above two graphs are based on a population of 34.7 million.
https://mycovidgraphs.blogspot.com/2021/11/the-malaysian-population-
From looking at the above three graphs, what we can state with certainty is that being vaccinated does not in any way appear to prevent COVID-19 positive test results. We see that unvaccinated, fully vaccinated and boosted people can all become infected with SARS-CoV-2 AND the unvaccinated overall generate fewer cases per capita than do fully vaccinated people.
So, clearly, IF positive test results for COVID-19 mean that a person is infected with COVID-19 and can infect others with COVID-19 THEN both vaccinated and unvaccinated people can both catch and transmit the virus.
Additionally, it’s not possible to track where any particular infection comes from. That is to say, we cannot know whether a new infection comes from either a vaccinated or an unvaccinated person.
Therefore, because all people, irrespective of vaccine status, are equally at risk, limiting different groups in different ways based on vaccine status makes no sense. Obviously, such policies are patently not fair.
Since unvaccinated and vaccinated people are equally capable of being the source of new infections (as measured by PCR and RTK tests), any policy that treats these different categories of people differently is clearly both unscientific and inappropriate.
Therefore, policies and SOPs that limit what unvaccinated people are able to do in society should be stopped in short order.
CONCLUSION TO PART 1.
The pandemic of death in Malaysia is ended. Measures that try to treat the vaccinated and the unvaccinated differently are misplaced, and fuel discrimination while showing little impact on infection rates. All COVID-19 control measures should cease in the shortest time possible.
Part 2. Was the Reaction to COVID-19 Necessary?
We understand that the title to this section may be challenging for many people. And, it is important to realise that the events of the last two years have crushed the economy both in Malaysia and globally, destroyed businesses and lives, and put millions of people around the world into poverty.
Should all of this damage be attributed to a virus alone? Or, should we look with clear eyes at the national response to a virus, and think about whether that response was either proportionate or necessary? What do we mean by this? A metaphor is in order – if one discovers a wasp nest in the house, would you say that burning down the house to get rid of the wasp nest is either appropriate or intelligent? We would guess that most people would say no.
So, in the context of COVID-19 the question is: did we burn down the house? Have the measures done more damage and destruction than the problem they are trying to solve? From the evidence that we present below you can come to your own conclusions.
1. What is a Pandemic?
We must begin with some history. A little more than a decade ago, the question of whether H1N1 influenza should have been labelled a “pandemic” sparked massive controversy. Prior to 4th May 2009, the definition of a pandemic was:

Figure 5. WHO Pandemic Definition Pre 2009
“an influenza pandemic occurs when a new influenza virus appears against which the human population has no immunity, resulting in several simultaneous epidemics worldwide with enormous numbers of deaths and illness”.
http://www.who.int/csr/disease/influenza/pandemic/en/index.html
searched on http://web.archive.org/web/20080612034723
We note that “enormous numbers of death” was a key component of the definition - a criterion that H1N1 failed to meet. In 2010, Council of Europe's Parliamentary Assembly (PACE) criticized the pandemic response to H1N1, stating that it led to waste of public money, and unjustified fearmongering about the health risks.
Subsequent to this criticism, rather than modifying procedures in order to avoid once again crying “wolf”, and putting the entire world into a panic, the WHO decided to change the definition of “pandemic”. They did so by removing “enormous numbers of death” from the definition.

Figure 6. WHO Pandemic Definition 2020
Note: This page was originally found at: https://www.who.int/influenza/pandemic/en/
A search done at the time of writing can no longer find this page as it appears to have been removed.
The post 2009 definition of pandemic from the WHO reads: “A disease epidemic occurs when there are more cases of that disease than normal. A pandemic is a worldwide epidemic of a disease. An influenza pandemic may occur when a new influenza virus appears against which the human population has no immunity.”
Definitions matter. They are absolutely key to the decisions that follow them.
Defining what constitutes a pandemic is a simple act, however it has tremendous social, economic and political impact. Whether or not the response to a pandemic is measured and appropriate, or consists of overkill leading to massive damage, depends very much on how pandemic is defined. An overly aggressive pandemic response will not only permanently damage the public trust in health officials and the government handling of any future pandemic, it also pushes a certain portion of the population to maximum suffering.
This is evidenced by the damage that has been done to very many people in Malaysia following the introduction of Movement Control Orders. Everything that has happened in Malaysia around COVID-19 since early 2020 is due to the change in the definition of pandemic that the WHO made in 2009.
No-one knows for sure why the WHO removed “enormous numbers of death” from the definition of pandemic, but that change is THE single most important reason for all the suffering being faced in Malaysia today. We believe very strongly that keeping “enormous numbers of death” as part of the definition for a pandemic is scientifically based and makes practical sense. Afterall, saying that there is a pandemic when very few people are dying leads naturally to actions that are likely to do more harm than good. Therefore, we will be using the pre-2009 WHO definition of pandemic in this section.
We would of course be very interested to hear from the WHO or other members of the public health professions as to why they changed the definition of pandemic to remove death. If the argument and evidence presented is both compelling and based on proper science and rational thinking we would be happy to change our position.
2. There is no evidence of a deadly pandemic in Malaysia in 2020
The first point that must be made is that, in 2020, there was no evidence of a deadly pandemic affecting Malaysia whatsoever. From the following graph, courtesy of the Malaysian Department of Statistics, we can clearly see that the All-Cause mortality in 2020 was very much in line with the previous 4 years. It was, in fact, slightly lower.

Figure 7. Malaysia Death Statistics up to 2021 Q2
Source: https://www.dosm.gov.my/v1/index.php?r=column/cthemeByCat&cat=401&bul_id=QTU5T0dKQ1g4MHYxd3ZpMzhEMzdRdz09&menu_id=L0pheU43NWJwRWVSZklWdzQ4TlhUUT09
The drop in all-cause mortality data in 2020 can be see more clearly from data presented on the Our World in Data website. From January 2020 right up until June 2021 the cumulative number of excess deaths in Malaysia was negative.

Figure 8. Malaysia All Cause Mortality 2020-2021 Source: Our World In Data
If there was a pandemic occurring within Malaysia then the opposite would be true. We would have seen a significant increase in excess mortality above the baseline.
In Fig 8 we do see such an increase of excess mortality above the baseline, but only after the roll-out of the vaccines. This raises an extremely important question. If Malaysia experienced normal, or lower than normal, All-Cause mortality in 2020 and the first half of 2021, what would cause the sudden increase in excess mortality beyond the expected baseline? Why did this change happen after the roll-out of the vaccination programme?
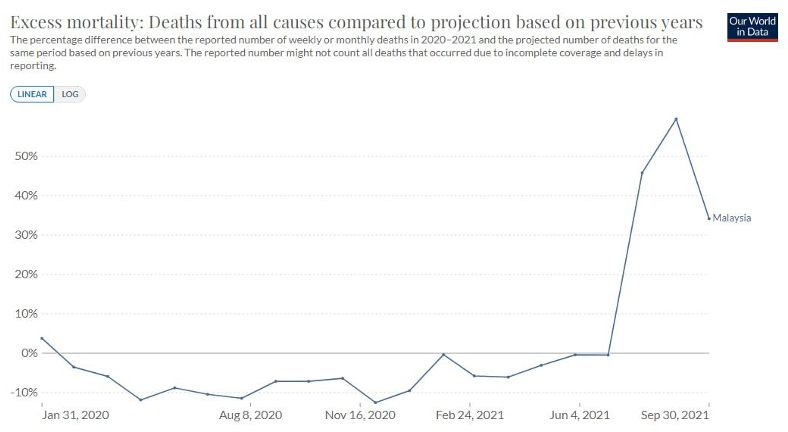
Figure 9. Malaysia Excess Mortality 2021 Source: Our World in Data
The significant jump in All-Cause Mortality is clearly obvious in the above graph.
Based on a response to a question addressed to the government in the Malaysian parliament in 2021 (see Figure 18 below) we learned that in 2020 there were only 471 deaths connected to COVID-19, most of them in the elderly. Data from the KKM GitHub puts the number at 578 in 2020. We must compare the scale of this number with the other major causes of death, which are presented below. In 2019 there were a total of 173,746 deaths in Malaysia, and the total number of deaths decreased by 4.2% in 2020. In 2019, there were 109,164 medically certified deaths, and 109,155 medically certified deaths in 2020.

Figure 10. – Deaths in Malaysia 2010 to 2020
The five major causes of death over those two years were heart disease, pneumonia, cerebrovascular disease, transport accidents and various throat and lung cancers. (Calculated from DOSM data).

Table 2. Major Causes of Death in Malaysia 2019 and 2020
Compare these numbers with 471 (or 578) and ask – why exactly was Malaysia locked down in 2020? Several hundred deaths compared to more than a hundred thousand is, in common parlance, a “nothing burger”. Given such a small number of deaths and therefore NO pandemic, was there ever any justification for the MCOs and other pandemic measures that have been applied in Malaysia? If so, what was that justification? And, what did the pandemic measures cost?
3. Panic Driven by a “Casedemic”
While it is clear from the all-cause mortality data that Malaysia did not have a deadly pandemic raging in 2020, there was however a pandemic of fear. This fear was driven quite directly both by the ongoing media hype, and by the incessant testing by healthy people to determine if they had somehow “caught” the virus supposedly responsible for COVID-19.
It’s important to understand that the PCR tests and RTK-Ag tests create what are known as “false positives”, which means you can test positive without actually having any virus in your system. Also, these tests pick up genetic material, and are not able to differentiate between live virus and dead viral material. Given this, the tests cannot tell whether a person is either:
a) infected with a virus or
b) likely to be ill from a viral infection.
So, during 2020 and all the way up until the present why did we see so much panic? The answer is simple. People were taught – through the media – to equate a positive test with “I am sick with something that will kill me”. This was, and remains, a blatant lie.

Figure 11. Cases vs Test Numbers in Malaysia. Source: https://github.com/MoH-Malaysia/covid19-public
There is a qualitative difference between ‘positive case’ and ‘positive test result’. A positive test result means that fragments of viral RNA are found in the body location from where a sample is taken. The person tested may or may not be infected and may or may not be sick. A positive case will have to show clinical symptoms of COVID-19 as well as showing a positive test result.
When we look at the data in the Fig. 11 above, we see something that should shock us all. It is very obvious that the more tests that were done, the more “cases” of COVID-19 that were identified. It was these positive tests that were being reported on a daily basis and called “cases”. The habit of labelling positive test results as ‘positive cases’ is the major factor that generated society wide panic!
Some may argue that more testing is necessary to discover all of the infected people, therefore it is natural to observe that when more tests are done the more true cases will be discovered. However, this is untrue.
KKM carried out mass testing believing that an insufficient amount of testing would lead to inadequate discovery of new infections. The point of mass testing is to test at an oversaturating rate, so that all cases would be detected.
One of the underlying assumptions of the SOPs, restrictions and contact tracing through digital surveillance has been that the testing would be accurate and fast enough to discover new infections in the population, following which measures could be taken in a timely manner to stop the spread of the virus.
In reality, this did not and could not happen. Why? The rate of testing would be slower than the rate of infection due to time lags in manufacturing, distributing, and interpretation of the results.
Since the rate of testing is slower than the rate of spread, required measures would not occur at the expected optimum time. That is why lockdowns based on testing would not work because lockdowns require the rate of mass testing to be greater than the infection rate, which is a wish that cannot come true.
The argument for mass testing also requires that 100% of the tests done give an accurate result. The evidence is very clear that this assumption is not true. Both of the tests used – RT-PCR and RTK-Ag tests are fraught with problems. Let’s look first at the PCR test.
The PCR test first takes a sample and, through a process of heating and annealing (reconnecting of DNA strands), the genetic material obtained from a sample is doubled. Each doubling is called a cycle. After a certain number of cycles of doubling has occurred, a test is done to try to identify the presence of a specific RNA pattern in the large amount of genetic material that has been created by the doubling process. We must understand that this process only identifies the presence of certain RNA sequences - it is not testing for the disease named COVID-19.
Of critical importance is the fact that RNA sequences identified in the PCR testing process could come either from live virus or from dead viral material, and whether the test picks up live virus or dead viral material depends on the number of doubling cycles that are done.
In the following graph (Figure 12) we see that the higher the number of cycles used beyond the optimum of 20 cycles, the lower the probability that sample material can be used to culture live virus successfully.
Even with 25 cycles of amplification, 70% of positive PCR tests are not clinical cases, i.e. the virus taken with a nasal swab or throat saliva cannot be cultured and it might be dead.
By 35 cycles of amplification 97% of the positive tests are non-clinical (i.e. they are false positives).

Figure 12.. Cycle Thresholds and Live Virus
Source: https://academic.oup.com/cid/article/72/11/e921/5912603
A dead virus that cannot replicate cannot infect a person. Therefore any test that is mostly picking up dead viral material cannot be viewed as a valid indicator of current infection by a virus. Since 2020, countries around the world have used CT values for the PCR test from 35 to 45 cycles meaning that almost all test results will have been false positives.
RTK-Ag also has a notoriously high false positive and false negative percentages when used at large scale. Different RTK-Ag products vary greatly in terms of specificity and sensitivity. It cannot be used as a meaningful method of testing.
Faulty testing that leads to faulty interpretation by the masses creates just one thing: panic. And, restrictions imposed on people who have tested positive with either RTK-Ag PCR without being symptomatic are entirely meaningless. The entire process of testing and quarantine with not-fit-for-purpose tests leads to massive economic, social and psychological damage with little or no benefit in terms of controlling a pandemic – if there is even a pandemic to be controlled.
4. Evidence of Data Errors in KKM Public Reporting and Messaging
COVIDNOW has become the primary conduit by which KKM communicates COVID-19 statistics to the public. One would expect the information presented through this channel to be both accurate and honest. Sadly, there appear to be significant errors in the information being reported through COVIDNOW, which is subsequently picked up by the media and spread widely throughout society.
A chart on COVIDNOW, "Cases per 100K People by Vaccination Status", shows infection rates that are 3.8 to 7.5 times more than values calculated using Malaysia Ministry of Health (MoH; KKM) data on GitHub. In addition, the chart shows that unvaccinated people are infected at a higher rate than vaccinated people. KKM’s GitHub data shows the opposite.

Figure 12. Cases for Vaccinated and Unvaccinated in COVIDNOW Source: https://covidnow.moh.gov.my/cases
In the chart (above) we see the following:
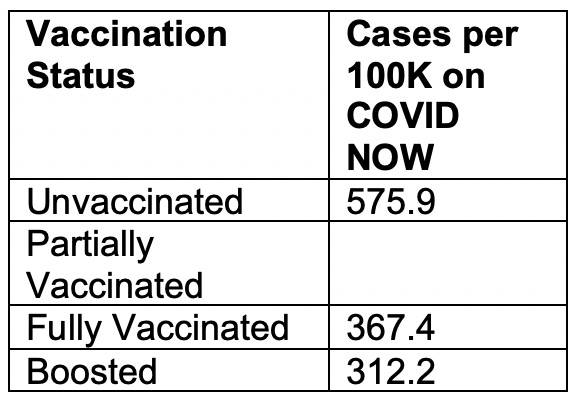
From these numbers it would appear that cases are occurring in the unvaccinated at a much rate higher than is true for the vaccinated. However, when using the raw data from the GitHub repository provided by KKM a totally different picture emerges. You can see from the table (table 3) below two important things:
(1) the cases per 100K people are significantly lower, across the board, than the numbers being reported by KKM on COVIDNOW.
(2) Secondly, and significantly, the cases per 100K people for unvaccinated are roughly the same as for partially vaccinated or boosted people, but LOWER than for fully vaccinated people.

Table 3. Correction to MOH Case per 100K Population Calculations, 2022-02-20
(This table uses population numbers that reflect days after vaccination required to achieve a new status)
Sources:
[1] https://covidnow.moh.gov.my/
Date: 2022-02-21
[2] https://github.com/MoH-Malaysia/covid19-public/blob/main/static/population.csv
[3]https://github.com/MoH-Malaysia/covid19-public/blob/main/epidemic/cases_malaysia.csv
[4]https://github.com/MoH-Malaysia/covid19-public/blob/main/vaccination/vax_malaysia.csv
Date: 2022-02-20
These numbers, direct from the KKM GitHub, give the lie to public statements by the DG of Health and other officials.
For instance, on February 22, 2022 Dr. Noor Hisham stated publicly that the unvaccinated who become seriously ill with COVID-19 are more at risk of death than vaccinated people.
From the above numbers (in the blue column), which are all drawn from the KKM GitHub with COVID-19 related statistics, it is clear that Dr. Hisham’s statement does not appear to be based on the data.

Note: The researcher who did the above table informed the Ministry of Health of this discrepancy on their Twitter account and asked for an explanation but did not receive a reply. Any inaccurate or misleading information should be corrected to ensure the public has the right understanding about cases and vaccination status. In addition, clarification is important to avoid unfair stigmatization of unvaccinated adults.
If the numbers that we have calculated are shown to be wrong, we are happy to make the necessary adjustments.
Another example of the MOH (KKM) publishing misleading statistics in the media is as follows.
On 18 August 2021, the Director General of Health, Noor Hisham Abdullah, published a post saying that there were 4 fully vaccinated deaths and 80 partially vaccinated deaths out of 12,993

At that time, data was not available to the public.
When data became available two weeks later on 4 September 2021, these are the real numbers:
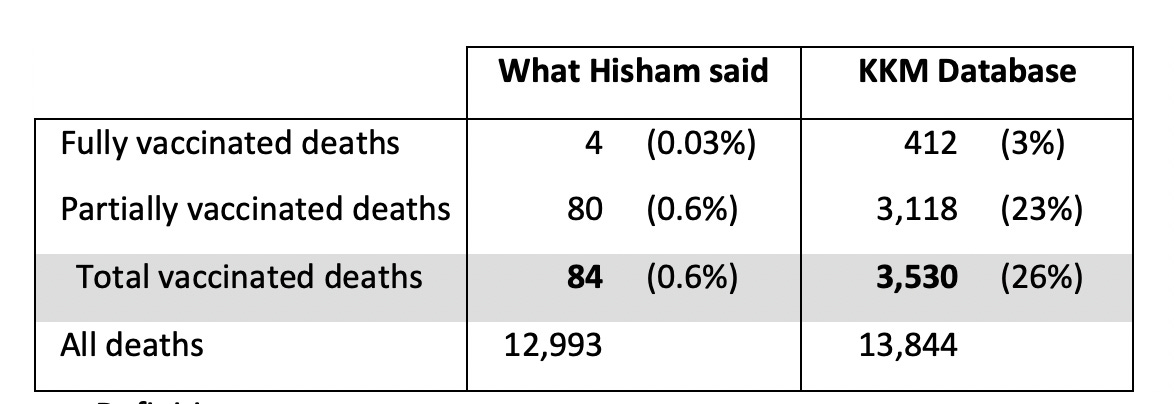
Definition:
Fully vaccinated: 2 doses > 14 days
Partially vaccinated: 1 dose + 2 doses ≤ 14 days
Source:
Linelist_deaths database, version 4 Sept 2021
https://github.com/MoH-Malaysia/covid19-public/blob/main/epidemic/linelist/linelist_deaths.csv
Vaccinated deaths made up 26% of all deaths in this period. This is more than 40 times higher than what Hisham said (0.6%). He published statistics that misled the public.
5. Deaths WITH COVID Verses Deaths FROM COVID
Another issue that must be taken into account is the methodology by which COVID-19 deaths are counted. The rules for reporting COVID-19 deaths (so-called WHO Guidelines) state that death by any cause should be reported as a COVID-19 death if COVID-19 is suspected. The recommended death reporting form for COVID-19 from the WHO is structured in such a way that, if COVID-19 is written on the form even if there are other factors, then COVID-19 must be listed as THE underlying cause of death.
The WHO guidelines state: “… in a probable or confirmed COVID-19 case ….. A death due to COVID-19 may not be attributed to another disease (e.g. cancer).”
The WHO guidelines for death reporting involving COVID-19 can be found here: https://www.who.int/classifications/icd/Guidelines_Cause_of_Death_COVID-19.pdf?ua=1
This means, in effect, that elderly people with serious illness who die in their 60’s, 70’s or older, are very likely to be marked as COVID-19 deaths even though they died from something else. It is by this mechanism that numbers of deaths “due” to COVID-19 have been inflated all around the world.
6. WHO Pandemic Preparedness Plan
Up until 2019, the WHO had a full pandemic preparedness plan. Member countries could refer to this and make use of the plan in the event of a pandemic outbreak. In that document WHO had actually recommended against:
(1) Mandatory face masks;
(2) Nationwide Lockdowns;
(3) Mass vaccinations in the middle of a pandemic
For some reason, Malaysia, and other governments around the world have proceeded to do the exact opposite to what was previously recommended in these preparedness plans. You can view the relevant documents here:
https://apps.who.int/iris/bitstream/handle/10665/329438/9789241516839-eng.pdf
CONCLUSION TO PART 2.
Whether or not there was a pandemic of death in Malaysia beginning mid-2021 is not in question, as we have seen a massive spike in deaths beginning around that time. The question that remains, of course, is whether the SARS-CoV-2 virus was the cause of these 2021 deaths, or whether 18 months of lockdowns, economic losses, psychological stress and experimental medical interventions had any role to play.
What is very clear is that in 2020 there is no evidence of a pandemic of death, and at the same time there is clear evidence of social panic driven by positive test results derived from tests known to have very high numbers of false positives.
From the evidence we now have available to us it is very clear that the actions to end the pandemic in Malaysia in 2020 were taken against something imaginary, not something real.
Given this evidence, the decision making processes that led to lockdowns, mask mandates, and coercion to force people to take novel and untested medical interventions aka vaccines must be seriously reviewed.
Part 3. Time to Evaluate the COVID-19 Vaccines
From very early on in the pandemic that probably never was there has been a strong global drive to use novel vaccines to solve the problem of the so-called COVID-19 pandemic. For some reason every piece of available investment and attention was placed on novel vaccines that were developed at “warp speed”. In order to ensure that these novel vaccines could be brought to market, Emergency Use Authorization was given – globally, and in Malaysia.
At the same time, alternative treatments using readily available and cheap medicines were either ignored or actively suppressed by governments, medical authorities, and the mass media around the world. Malaysia was no exception. There are important questions as to why this might have happened that need to be addressed. Suffice it to say that the Emergency Use Authorizations for novel COVID-19 vaccines could only be given if there were no other alternative treatments available.
For the purposes of this paper we will ignore the question of alternative treatments, and simply focus on trying to evaluate the COVID-19 vaccines based on the data now available. Afterall, the COVID-19 vaccines have been “in market” for almost one year now.
1. An Important Concept – Absolute Risk Reduction vs Relative Risk Reduction
Before the Emergency Use Authorization (EUA) was given by the US Federal Drug Administration (FDA) to Pfizer for their new mRNA “vaccine”, the company claimed that the Pfizer–BioNTech COVID-19 vaccine gives a 95% relative risk reduction. Based on various studies that have been done, the efficacy for other COVID-19 vaccines on the market (reported as relative risk reduction) was 94% for the Moderna–NIH, 90% for the Gamaleya, 67% for the J&J, and 67% for the AstraZeneca–Oxford vaccines.2
Very quickly this information became sound-bites for the media, with claims being made of 95% effectiveness for Pfizer-BioNTech, 94% for Moderna, etc. This sort of result sounds very impressive. It sounds like a person is protected 94% or 95% of the time. However, as with many things in science, the devil is in the details.
What most people don’t understand is that the efficacy numbers reported were for Relative Risk Reduction. This is defined as: “the ratio of attack rates with and without a vaccine”. What is attack rate? It simply refers to the percentage of a group of people who become infected with the virus.
In the Pfizer trial, 18,198 people were given the vaccine and only 8 developed COVID-19. That’s an attack rate of 0.04%. There were 18,325 people in the unvaccinated group, and of those only 162 people contracted COVID-19, which is an attack rate of 0.88%. This difference was then used to calculate the Relative Risk Reduction of 95%3 (0.88% attack rate dropping to 0.04% attack rate).
The problem with Relative Risk Reduction is that it does not tell you how much your overall risk is reduced by vaccination. In order to know that we have to use Absolute Risk Reduction.
In the above example for Pfizer BioNTech, 0.04% of the vaccinated group became infected with COVID-19 and 0.88% of the non-vaccinated group became infected with COVID-19. As you can see, the risk of a COVID-19 infection for the non-vaccinated group was already very low, at less than 1%. The Absolute Risk Reduction is therefore only 0.84% (from 0.88% risk down to 0.04% risk).
As the authors of: “COVID-19 vaccine efficacy and effectiveness—the elephant (not) in the room” write: “ARRs tend to be ignored because they give a much less impressive effect size than RRRs: 1·3% for the AstraZeneca–Oxford, 1·2% for the Moderna–NIH, 1·2% for the J&J, 0·93% for the Gamaleya, and 0·84% for the Pfizer–BioNTech vaccines.”
We can see this clearly in the following table:

Table 4. Comparison of RRR and ARR for Different Vaccines
Source: https://www.thelancet.com/journals/lanmic/article/PIIS2666-5247(21)00069-0/fulltext
What about the Mainland Chinese produced Sinovac Vaccine? According to the WHO:
“A large phase 3 trial in Brazil showed that two doses (of Sinovac), administered at an interval of 14 days, had an efficacy of 51% against symptomatic SARS-CoV-2 infection, 100% against severe COVID-19, and 100% against hospitalization starting 14 days after receiving the second dose.”
Although not specified on the WHO documentation, these numbers will be Relative Risk Reduction Numbers, as opposed to Absolute Risk Reduction Numbers. As of this writing we have not been able to assess the Absolute Risk Reduction numbers for Sinovac.
The basic point that we need to understand is that RRR should be seen against the background risk of being infected and becoming ill with COVID-19. This varies over time, with different populations. But, very clearly, we need to ask the question: if the Absolute Risk Reduction is only 1 or 2 percent, can we actually say that there is a very clear and present need for everyone in the population to become vaccinated?
2. Effectiveness of COVID-19 Vaccines Ranges from Poor to Negative
Over the last 18 months the people of Malaysia have been told repeatedly that the COVID-19 vaccines are both safe and effective. As is worldwide, they have been regaled with the messaging that the COVID-19 vaccines (e.g. Pfizer BioNTech) reduce infection and death by 95%. It is important to understand that this refers to RRR, not ARR. We must remember that RRR simply compares a relative change regardless of how small it is.
That said, with many months of real-world data under our belts, how do the various vaccines used in Malaysia stack up in terms of either RRR or ARR? When we analyze the open-source data on the KKM GitHub repository we discover that the promised Relative Risk Reduction actually does not hold up over time.

Figure 13. Relative Risk Reduction from COVID-19 Vaccines in Malaysia. Data Source: KKM GitHub Repository
When we analyze the open-source data on the KKM GitHub repository it is very clear that protection against COVID-19 infection (as measured by tests) drops over a few months. Importantly, for fully vaccinated and partially vaccinated people, after several months the RRR goes into negative territory meaning that a person is MORE likely to get infected with COVID-19 than a person not vaccinated.
In contrast to the vaccines, natural immunity to COVID-19 is robust, complete and durable. You can find out more about natural immunity against COVID-19 at this link: https://brownstone.org/articles/natural-immunity-and-covid-19-twenty-nine-scientific-studies-to-share-with-employers-health-officials-and-politicians/amp/
Given the importance of natural immunity, as with the question about cheap and effective alternative treatments, there is also an open question about why there has been no mention of natural immunity in the entire mainstream COVID-19 debate? Given the damage done to society over the last two years by measures implemented to stop what was believed to be a pandemic, this question also must be seriously addressed.
In Fig 13 above we looked at the drop in RRR for the COVID-19 vaccines over time. The drop over time clearly indicates there is a problem with COVID-19 vaccine efficacy. When we look at ARR, however, the situation would appear even more dire.

Figure 14. ARR From COVID-19 Vaccines in Malaysia Data Source: KKM GitHub Repository.
As with the RRR graph, we see that the ARR drops to below zero after a few months. More importantly, however, is that the absolute BEST risk reduction for fully vaccinated people is less than 0.04%. Based on such numbers there is clearly very little meaningful benefit for a person to receive the COVID-19 injection.
To put this very simply the data are telling us that the vaccines have very low meaningful effectiveness in the short term and, over time, they appear to start harming the immune system of recipients making them MORE vulnerable to disease than if they had not been injected in the first place.
3. No Net Benefit from COVID-19 Vaccination
Looking at the data in another way we see that there is very little difference in infection rates for people who have not been vaccinated, compared to vaccinated people of different levels of vaccination status. Figure 15 (below) shows just how closely the curves match for infections of both vaccinated and unvaccinated people, suggesting very limited benefit from the vaccines.
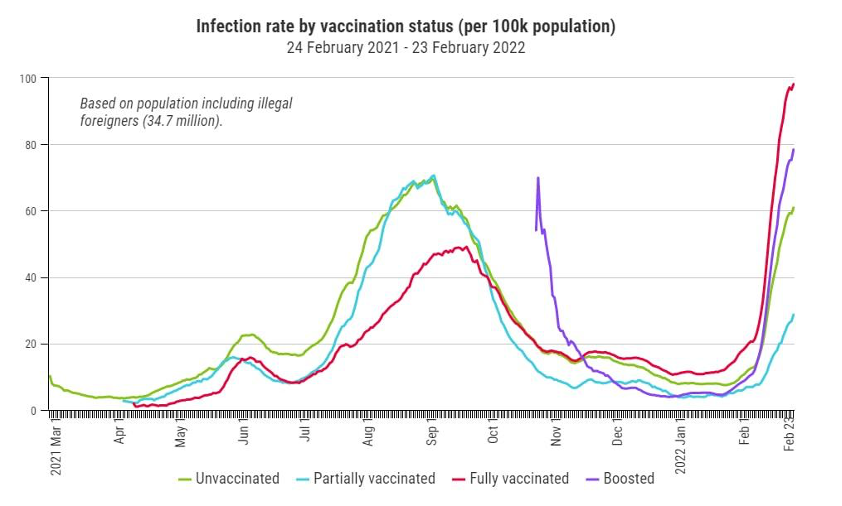
Figure 15. Infection Rates by Vaccination Status. Data Source: KKM Github Repository.
Looking at the case fatality rates for different vaccination status (Figure 16 below) we see that the number of doses received has some, but minimal, bearing on the chances of dying with COVID-19. Specific points to be aware of are:

Figure 16. Case Fatality Rates by Vaccine Status. Data Source: KKM GitHub Repository.
(1) It’s noteworthy that non-vaccinated people overall have a lower death rate after catching symptomatic COVID-19 than people given ONE dose;
(2) While the fully vaccinated show a lower death rate than the unvaccinated, the paradox is that one must pass through a period of “partially vaccinated”, an area of much higher risk, in order to reach that lower risk level;
(3) And, of course, in absolute terms (i.e., ARR) the benefit from being fully vaccinated is so small that most people would not consider it worth the effort.
The fact that one needs to first go through a period of much higher risk in order to get such a miniscule absolute risk reduction means that the calculation of risk by individuals would generally lead to the conclusion that the COVID-19 vaccines are unnecessary.
Importantly, there is now evidence that in every month, the vaccinated are sicker than the unvaccinated. Data from 2.9 million people show that the vaccinated are 37% more symptomatic than the unvaccinated, suggesting that the vaccines are making things worse, not better.

Figure 17. Vaccine status and symptomatic illness. Data Source: KKM GitHub Repository.
4. COVID-19 Situation is Worse After COVID-19 Immunization Program
We start this section by looking at a parliamentary question that was asked in late 2021, concerning COVID-19 (related) deaths.


Figure 18. Parliamentary Q&A on COVID-19 Deaths in Malaysia.
We see that in 2020, before there were any COVID-19 vaccines available, there were only 471 deaths categorized as being linked to COVID-19. However, in the first 9 months of 2021 (up until October 3, 2021) there were 26,212 COVID linked deaths in Malaysia. The total number of deaths in Malaysia connected to COVID-19 for the full year in 2021 amounted to approximately 30,000.
This is equivalent to a 63x increase in COVID-19 related deaths between 2020 and 2021.

Figure 19. Death Spike After Vaccine Roll-out in Malaysia. Source: Malaysia Department of Statistics.
More importantly, as mentioned in Part 2, we see from official Malaysian government statistics (Figure 19 above) that in 2020, the All-Cause Mortality in Malaysia was LOWER than previous years. However, by Q3 of 2021 All-cause mortality showed a massive spike, significantly higher than the 10-year average.
In the following two charts we are looking at the number of deaths in Malaysia both before and after PICK (i.e., the rollout of the vaccine program).
Clearly, before the roll-out of the vaccines in Malaysia almost all of the people who died WITH (not necessarily from) COVID-19 had comorbidities (i.e. other life threatening conditions). Only a very small percentage of people died apparently from COVID-19 alone. This mirrors the situation in the rest of the world. In the US, for instance, according to CDC data over 96% of the supposed COVID-19 deaths actually had multiple co-morbidities but the deaths were marked as COVID-19 deaths based on instructions from the World Health Organisation (WHO) and the CDC.
It’s important to understand from this chart that prior to vaccination roll-out VERY FEW people under the age of 50 died with COVID-19 involvement. This indicates that there was never any serious danger to healthy young people, and that only those who were already unhealthy, and of an advancing age, were at any serious danger from COVID-19.

Figure 20. COVID-19 Deaths with and without Comorbidities Before Vaccination Roll Out
After the vaccine roll out in Malaysia, however, things changed dramatically. In the chart below we see three significant changes.
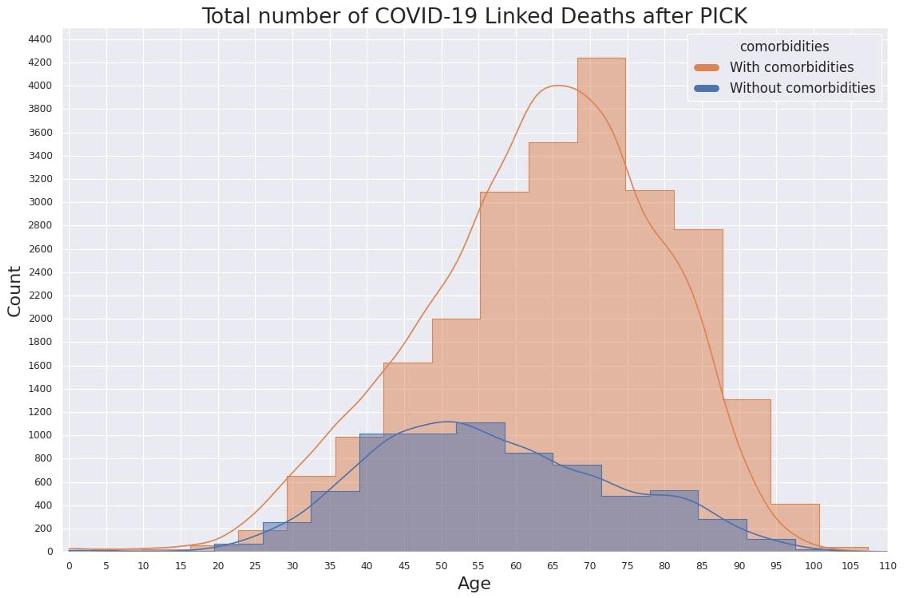
Figure 21. COVID-19 Deaths with and without Comorbidities After Vaccination Roll Out
(1) the total number of deaths increased many fold, from hundreds to thousands;
(2) many younger people started dying, in the thousands rather than in single digits;
(3) a significantly larger number of younger adults without comorbidities have been dying in large numbers.
This suggests that, at best, the COVID-19 vaccines have done nothing to stop a pandemic of deaths in Malaysia. However, this data raises another extremely important question. Is it possible that the vaccines themselves, or something about the vaccination process, could be implicated in the increasing deaths? While variants may also be playing a role here, experts have warned that leaky vaccines rolled out during a pandemic are likely to cause more dangerous variants to emerge. Luc Montagnier, Dr. Robert Malone and other international experts have warned of the seriousness of such a danger.
If the COVID-19 vaccines are not only low in long-term effectiveness, but also implicated in causing death above and beyond what might have happened from the COVID-19 illness itself, then we have a major problem.
5. COVID-19 Vaccines Show Correlation with Cases and Deaths
Is it possible that the mass vaccination program itself, either directly or indirectly, is responsible for the massive increase in deaths that we are seeing? Evidence in the public record strongly suggests that this is a possibility.
From the following chart (Figure 22) we can see an extremely interesting phenomenon. Before the COVID-19 vaccines were rolled out, the chance of death for children, teens and adults connected to COVID-19 was extremely low. However, subsequent to the vaccine rollout, unvaccinated adults in particular have come to be at higher risk of death linked to COVID-19.

Figure 22. Death Rate by Age Group and Vaccination Status. Data Source: KKM GitHub Repository.
This of course may have been a result of variants, such as Delta, but the question also needs to be asked – have the vaccines themselves played a role in creating a more dangerous environment for everybody – unvaccinated people included?
The following chart (Figure 23) looks at the case fatality rate for all time in Malaysia (i.e., since early 2020). Clearly, before vaccines were being delivered the case fatality rate was only 0.44%. Since we know from other data that almost all the fatalities were occurring in elderly people, this is a low number overall. We can also see that, after the start of the vaccination roll out the case fatality rate linked to COVID-19 increased overall, even affecting the unvaccinated.
When we look at the next chart, we see that the number of COVID-19 cases being identified in Malaysia closely follows the number of vaccines being given. The infection rate of adults (light purple line) follows vaccine doses 1+2 in lockstep. The infection rate for seniors also increased in lockstep, but at a lower rate.

Figure 23. Case Fatality Rates and Vaccination Status. Data Source: KKM GitHub Repository.
The graph in Figure 23 has been generated from the numbers in the following table, as updated on February 26, 2022.

Table 5. Case Fatality Rates by Vaccination Status Figures. Source Data: KKM GitHub Repository
In the chart below (Figure 25) we see the same pattern, but this time with deaths rather than cases. As with cases, we see that deaths follow the daily dose count, with the curves being almost the same. What’s important to note is that the curve for vaccination LEADS the curve of cases and deaths by a consistent amount of time. This indicates causation.

Figure 25. Case Fatality Rates and Vaccination Status. Data Source: KKM GitHub Repository.
This suggests very strongly that there is some relationship between the vaccines and the number of cases and that the vaccines, or the vaccination process, may well be in some way causing the cases to rise. One hypothesis is that vaccinated people got infected at the PPVs and brought it home to the unvaccinated. Offices and malls were closed, so the most likely place where thousands of people got infected every day is the only big gathering in town - at mega PPVs. Figure 26 below details how this might have happened.
Looking at the chart we can see that cases increased in lockstep with vaccine doses given. The country was locked down after Hari Raya, but cases started going up vertically even during lockdown when smaller PPVs were closed and all moved to mega PPVs. Delta was just beginning and being highly infectious, was spread at huge gatherings at PPVs and Covid Assessment Centres (CACs).

Figure 26. The Role of PPVs in Driving the Pandemic. Data Source: KKM GitHub Repository.
Cases started going down as quickly as they went up, with the closure of mega PPVs. In mid-September, vaccination for teenagers started. It was given in their schools, and it did not cause an increase in cases. This shows that huge gatherings at mega PPVs most likely caused the vertical increase in cases, while smaller centres did not cause such problems.

Figure 27. Daily Cases and Cumulative Vaccine Doses. Data Source: KKM GitHub Repository.
In Figure 27 (above) we can clearly see the role that the Mega PPVs probably played. The first case of Omicron was detected on December 2, 2021, but there was no increase in cases, even with subsequent imported cases. In fact, daily cases kept going down, until January 15, 2022, when four mega PPVs were opened in KL.
Within 5 days of the opening of the mega PPVs, on January 20, 2022, cases started going up.
The question has to be asked. Given that large gatherings of people were forbidden for normal life, why was the MOH allowed to create huge gatherings while telling people to avoid holding huge gatherings, knowing that Omicron is extremely infectious?
The country was doing just fine with smaller PPVs, and consolidating many centres into one big centre with no increase in vaccine doses given clearly is a plain waste of money. And, it obviously drives infection. We can see clearly the increase started 2 weeks before Chinese New Year. After Chinese New Year, cases went up vertically again.
The final chart (Figure 28) maps cumulative vaccine doses with cumulative number of cases. The relationship here is unmistakable. There is an almost perfect correlation between vaccine doses administered and cumulative cases identified.
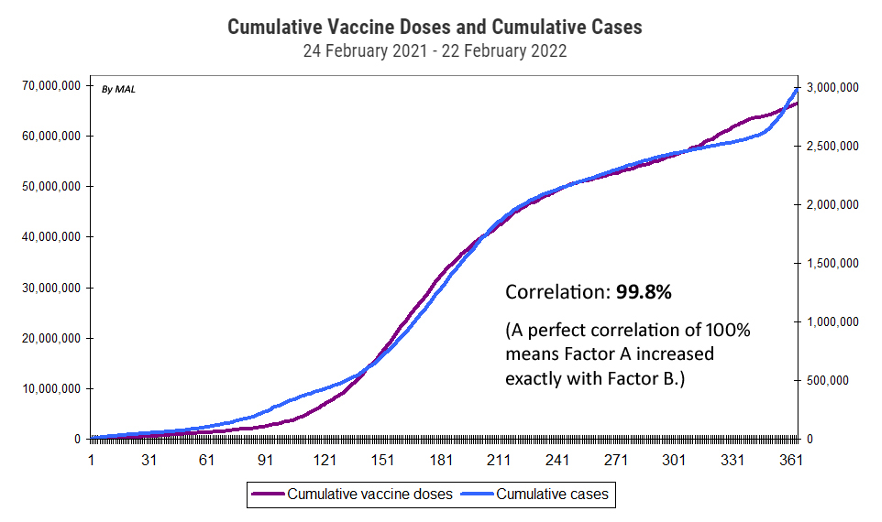
Figure 28. Cumulative Vaccine Doses and Cumulative Cases. Data Source: KKM GitHub Repository.
This is either more evidence that the vaccies are somehow involved in causing the rise in cases, or some aspect of the way in which the entire programme was organized has created a very intersting artifact.
6. Are the COVID-19 Vaccines Actually Dangerous?
Since the beginning of the roll-out of the COVID-19 vaccines in Malaysia the rakyat have been told on a daily basis that the new experimental injections are perfectly safe. The media have widely reported claims from the Ministry of Health that there are no deaths or injuries from the COVID-19 vaccines, either in Malaysia or globally.
This has recently changed. Following some high profile AEFI cases (Adverse Events Following Immunisation), the Ministry of Health is now beginning to tell the people that there is some risk in the COVID-19 immunisation process.

It would appear that there are more dangers from the COVID-19 vaccines than the people have been previously informed about.
We shan’t go very deeply into the issue of how much vaccine injury may be taking place, other than to bring three key pieces of information to the reader’s attention.
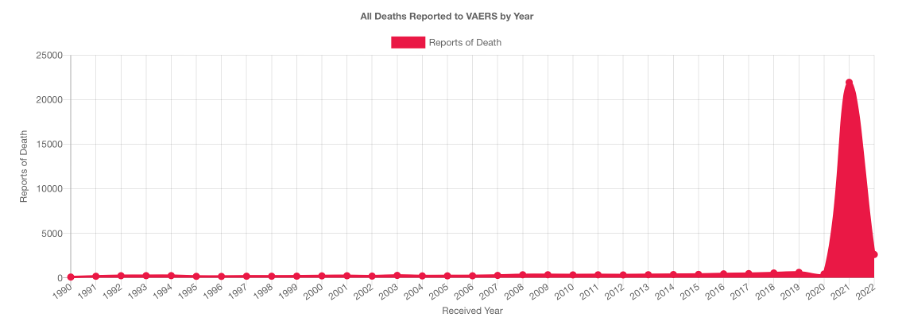
Figure 29. VAERS Death Spike Post COVID-19 Vaccines Source: https://openvaers.com/covid-data
Firstly, in the US Vaccine Adverse Event Reporting System (VAERS) we can see a massive increase in deaths related to the COVID-19 vaccines. Figure 29 (above) shows the spike in deaths following COVID-19 vaccination roll-out that is 1000 to 2000 times higher than all adverse event reports for all other vaccines over a period of more than 20 years.
We are told that there is no vaccine injury in Malaysia. Given the international data this is difficult to accept at face value.
Secondly, Moderna (and Pfizer) stocks have started to crash as insiders dump their holdings. Moderna is one of the manufacturers of the new mRNA vaccines.

Figure 30. Moderna Stocks Tank. Source: https://www.forbes.com/sites/jonathanponciano/2022/02/14/moderna-stock-crash-losses-top-140-billion-as-insiders-sell-millions-of-dollars-in-shares
Whenever insiders in companies start running for the hills, one must assume that there is a major problem which is very likely to soon become public.
Thirdly, problems originating from vaccination are starting to surface in insurance company data. A large German heath insurance company – BKK Pro Vita - analyzed data from 10.9 million insured individuals regarding vaccination complications. One of the board members in BKK is reported to have stated that the data is “alarming”.
The company suggests that COVID vaccine side effects are “significantly” underreported. The company said its analysis revealed a “significant alarm signal” and said "a risk to human life cannot be ruled out.”
Sources:

and
https://childrenshealthdefense.org/defender/covid-vaccine-injuries-german-health-insurer/
It is still early days, but if there are major health problems being caused by the new mRNA vaccines – a hypothesis that seems very likely based on the VAERS reports and other early warning systems like the UK Yellow Card System – then we should expect to see large increases in claims coming through insurance companies in the months ahead.
Finally, because the mainstream media have refused to publish most facts around the COVID-19 pandemic and the vaccinations, most people are not aware that – for instance – Pfizer’s own randomized control trial did not prove safety, it proved HARM. This information is the result of a court enforced FOIA (Freedom of Information Request) in the USA.

Figure 31. Pfizer Trials Proved HARM
Source: https://www.canadiancovidcarealliance.org/wp-content/uploads/2021/12/The-COVID-19-Inoculations-More-Harm-Than-Good-REV-Dec-16-2021.pdf
As the authors of this report make plain, “There is no benefit to a reduction in cases if it comes at the cost of increased sickness and death.”
This perhaps explains why the FDA and Pfizer have been fighting in court so hard to prevent any data about both the control trials, and the post marketing research, to be released to the public for 75 years. Why would that be? What are they trying to hide?
CONCLUSION TO PART 3.
In part 3 we identified what appears to be the elephant in the room. It’s the major problem that nobody wants to talk about. From the data presented we have a very clear picture that the COVID-19 vaccines not as effective as advertised.
The conclusion that we must draw is that the vaccination roll out in Malaysia has done absolutely nothing to stop deaths that are connected to COVID-19 in Malaysia. On that basis alone the programme can only be judged as an abject failure.
Beyond that failure it now appears that the vaccines themselves, or the way the vaccination process has been organized, or both are responsible for creating a very large increase in death and COVID-19 infection in Malaysia.
Given that the effectiveness of the vaccines is minimal, and that it is very likely that the vaccination process itself causes health problems, all measures designed to get people to vaccinated, especially all coercive measures, should be stopped immediately.
ICACC – Independent Citizens Against COVID Corruption
For more information you can email to: hkicacc@ctemplar.com
Letter to Malaysian MPs: